

University Road is said to be approximately 30m wide.

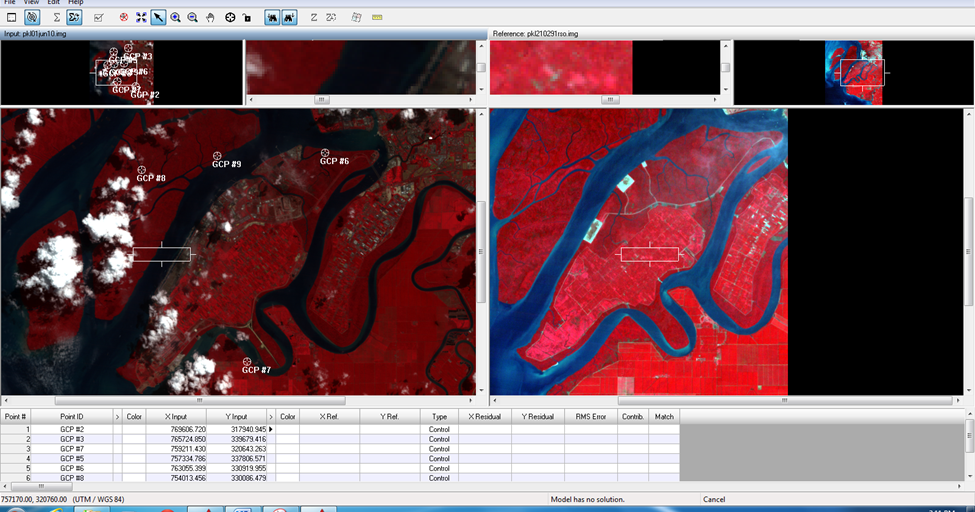
However, care should be taken when choosing the correct position of a GCP, as a scanned map might add to the RMS error, because roads tend to be drawn wider than they actually are, or even slightly displaced, i.e. Clustering GCPs in the centre of the image will not give accuracy to the transformation of coordinates in the extremities of the image.Īdding GCP from a map is easy and straightforward. Unfortunately, adding GCP from the given map is also limited, as the map covers much less area than the actual image. This is not he case in the provided data, as no corners are used, and there is a slight over-representation of GCP in the lower half of the image. The GCPs should be spread evenly over the image, covering the whole image, and be placed as much as possible into the corners of the image, to give best coverage for calculating the transformation. The table shows the minimum and maximum values before (B) and after (A) the dark pixel subtraction. Bands 5 and 7 normally need not to be corrected (Mather, 1999), which is also apparent in the table below. After subtracting the minimum DN, the corrected image appears with a normalised true colour approximation. This is why the 100/70% contrast brightness is bluish bright, since the path radiance is highest in band 1, which is chosen as the blue colour component. Thus, the dark bluish pixel values are replaced by bright tones in the right image, speckled with red tones.Ĭorrected image with default 50/50% - and 100/70% brightness/contrastĪfter correcting for luminance, all pixel values start more or less from 0, which is why the default image is almost totally black compared to the original image.ĭue to the effect of path radiance the histogram initially does not have its lowest value at zero. The brightness tool moves the colours into white, while contrast stretches the histogram for better colour differentiation. The pixel values in the bands used for display (1-3) take up only about the first 40 of the possible 256 values, which is why the image seems dark. Original image with default 50/50% - And 100/70% brightness/contrast ERDAS uses a convolution method, which passes an averaging matrix across the image, which may account for stripes still being apparent in the image. Using the cumulative histogram of one of the detectors, meaning the cumulative histogram of every 16th line, a comparison is made, and an output pixel value is calculated. In the latter a target histogram is constructed, which is the cumulative histogram of the entire image. In the first, the mean and standard deviation of the histograms of every 16 bands are similarly forced to be equal to the mean and the standard deviation of all the pixels in the image. Mather (1999) describes two ways of destriping, using a linear method or histogram matching. The destriped image shows a small improvement compared to the original image. Since the missing scan line is at x = –200, this is row number 201.ĭestriped image (left) and original image (right). Regarding the position of the missing scan line, to find the correct row number, it must considered that the image peak-tm84 has 512 rows and 512 columns according to it’s image info, with coordinates upper left 1/1(y/x) and lower right 512/-510 (y/x).


 0 kommentar(er)
